Icons | Function | Description |
 | 3D Single Shot | Click to complete one shot and generate point cloud, depth map, 2D map, and confidence map at the same time. |
 | 3D Burst | Click to start continuous shooting, the icon changes to |
 | 2D Single Shot | Click to complete 1 shot and generate a 2D image. |
 | 2D Burst | Click to start continuous shooting, the icon changes to |
Data Types
The camera shooting data includes the following four types. Click the icon buttons to switch between the data types for viewing.
| Icon | Display Type | Operation | Description | Example |
|---|---|---|---|---|
 | 3D Point Cloud | SeeNo. Section 3.3.3. | A collection of point data on the object surface captured by a camera. | 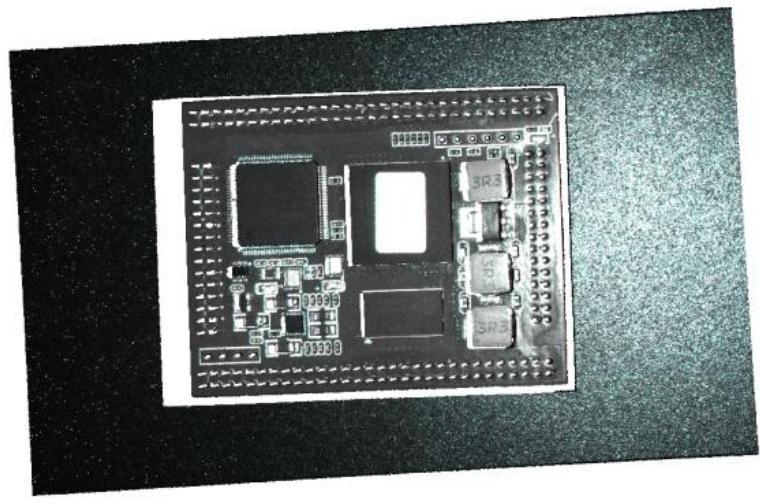 |
 | Depth Map | When the mouse cursor is placed on an image point, the X, Y coordinate values, depth value and grayscale value of the corresponding point can be displayed. | Each pixel value in the depth map is called a depth value, which represents the distance between a point in the scene and the camera. The area in the depth map that is black and has a depth value of NAN indicates missing data. | 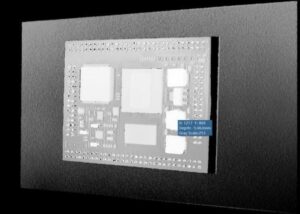 |
 | 2D Plots | When the mouse cursor is placed on an image point, the X, Y coordinate value, grayscale value (grayscale camera) or RGB value (color camera) of the corresponding point can be displayed. | 2D images can be compared with 3D point clouds to check scene lighting, object placement, and missing corresponding point clouds. | 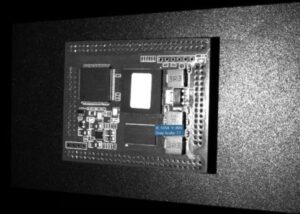 |
 | Confidence map | When the mouse cursor is placed on an image point, the X, Y coordinate values and confidence value of the corresponding point can be displayed. | The confidence map is equivalent to the probability density function of the new image. The darker the point in the map, the lower the confidence. | 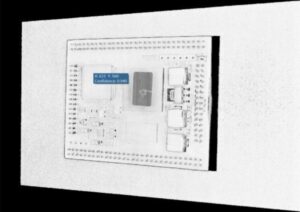 |
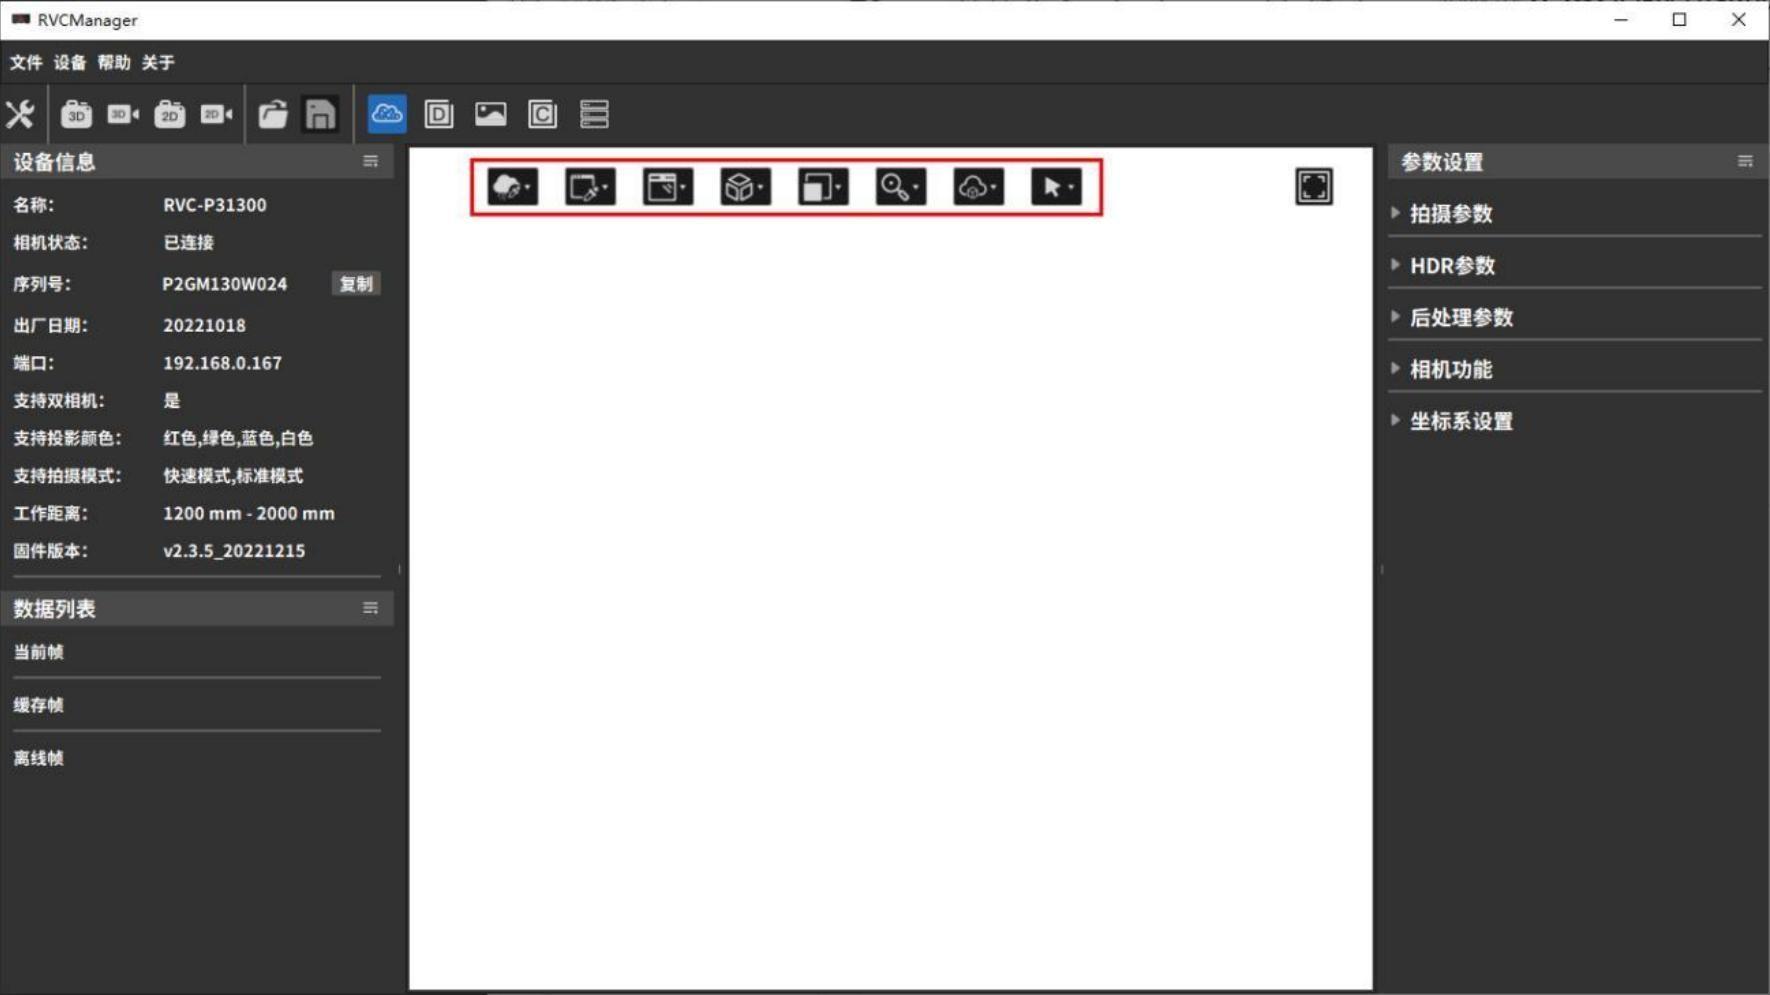
In addition to viewing different image data, RVCManager also provides the function of viewing shooting parameters.
Shooting parameters include device name, shooting mode, shooting and post-processing related parameter setting information, and coordinate system information. Click the icon ![]()
Available for viewing.
View Operations
When viewing point clouds or images, you can adjust the display using the mouse and keyboard. See the table below for operation methods.
| Function | How to operate |
|---|---|
| View Zoom | Place the mouse cursor in the content display area and scroll down: the view is zoomed out. Zoom-out factor: 1.5. Place the mouse cursor in the content display area and scroll up: the view is zoomed in. Zoom-in factor: 1.5. |
| Image translation | Click the left or right mouse button to drag: the depth map/2D map/confidence map moves in the direction of the mouse drag |
| Point cloud translation | Click the right mouse button and drag: the point cloud moves in the direction of the mouse drag |
| Point cloud selection | Click a When the distance measurement function is turned on, click the middle mouse button to select the corresponding distance measurement point. When selecting the rotation center, click the middle mouse button to select the corresponding rotation center. |
| Point cloud rotation | Click the left mouse button and drag up and down: the point cloud rotates along the Z axis. Click the left mouse button and drag left or right: the point cloud rotates along the X axis. |
| View Reset | Keyboard space bar: Switch back to the initial point cloud perspective. |
Window Operations
Point clouds/images can be viewed directly in the content display area of the main interface. Using the buttons below, you can switch the display m
icon | Display Type | illustrate |
 | Window Full Screen | Click to display the point cloud in full screen, and the icon changes to |
 | pop up | Click to display the depth map/2D map/confidence map in a separate window. The icon changes to |
3.3.3 Point cloud display
When viewing 3D point cloud data, you can click the floating parameter display button above the content display area to configure the 3D point cloud viewing mode.
| icon | Display parameters | Functional Description |
|---|---|---|
 | Point cloud color | Selectable point cloud display color (white/black/custom color/pixel color/thermal color/pseudo color) |
 | Background Color | Select the background color of the content display area (white/black/custom) |
 | Auxiliary display | Options to assist in viewing point cloud distribution (coordinate system/user coordinate system/plane/normal vector/data range/rotation center) |
 | View Switching | Switch point cloud display perspective (front/back/left/right/pitch/elevation/home) |
 | View Zoom | Zoom in and out of the point cloud view. The zoom factor is 1.5 |
 | Point cloud size | Scale the size of individual points in the point cloud view |
 | Range Settings | Set the point cloud range and heat map display range, and update the point cloud after successful setting |
|---|---|---|
 | Select point to measure distance | You can select several points from the point cloud to complete simple measurement, see Select point distance measurement Example |
· Point cloud color
You can choose the color display mode for the point cloud. The available options are Solid Color, Pixel, Thermal, and Pseudo Color.
| Point Cloud Color | Description | Example |
|---|---|---|
| Solid Color | Displays the point cloud in a solid color. The color can be set to black, white, or a custom color. By observing the distribution of blank areas, you can check for point cloud missing data. | 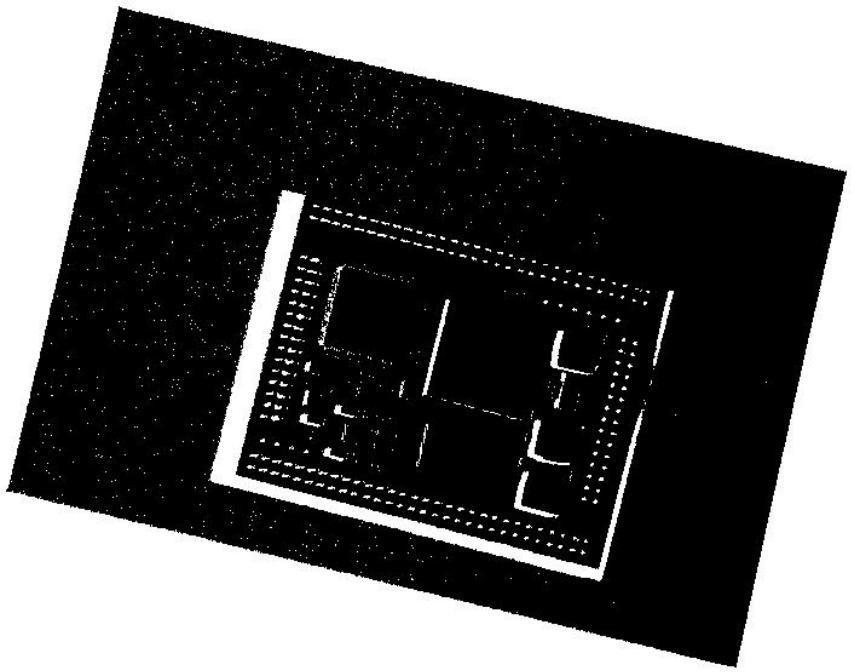 |
| Pixel Color | Display the pixel color of the photographed object to make the point cloud effect clearer and more intuitive. Grayscale cameras display as grayscale images, and color cameras display as color images. | 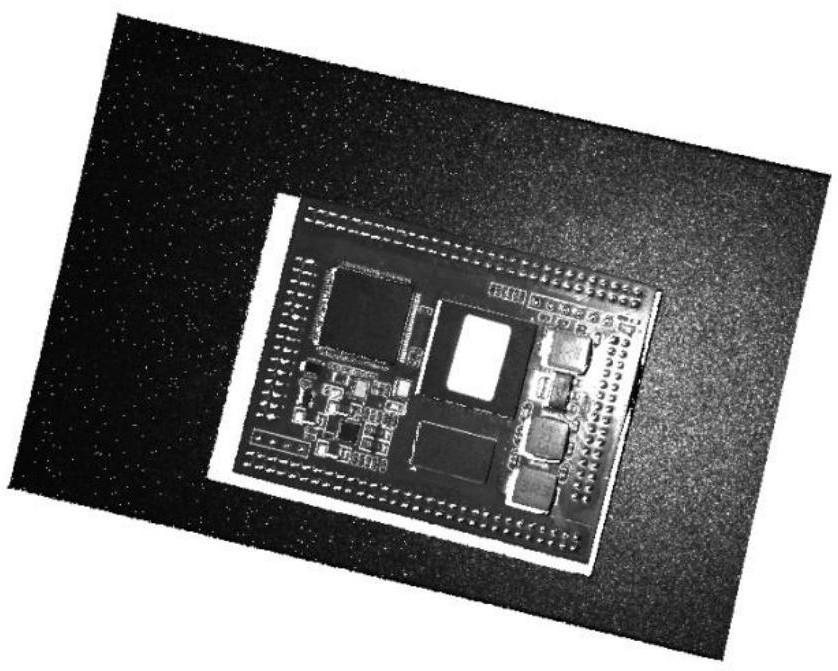 |
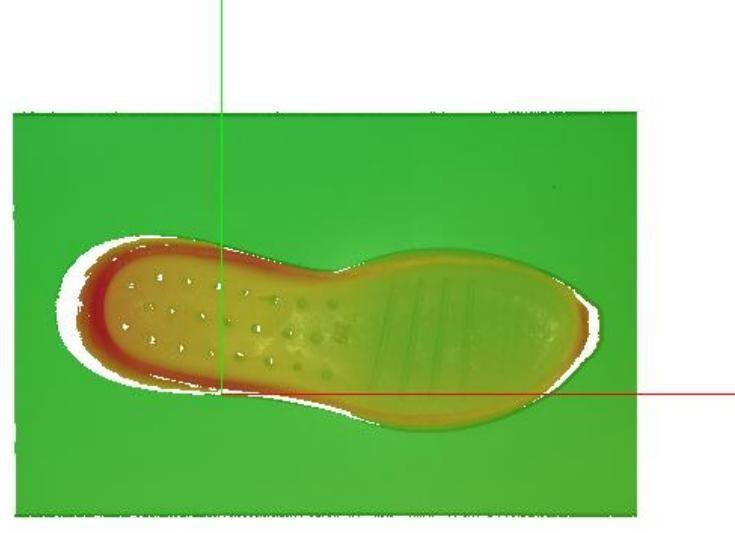
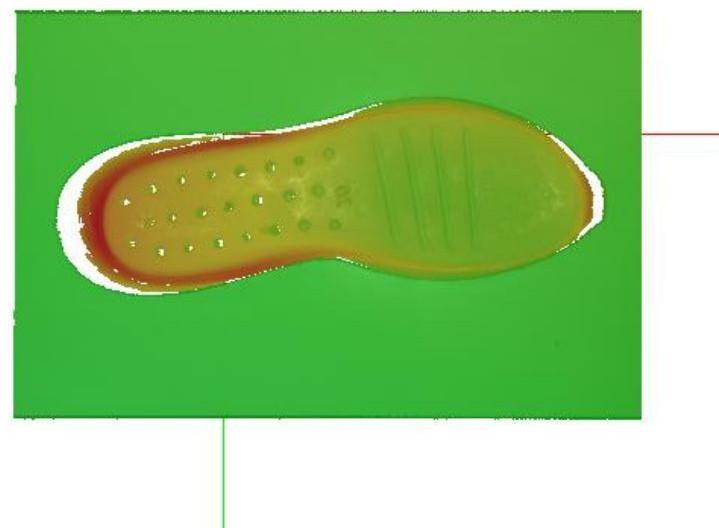
| Thermal Color | Uses different colors to represent the “height information” of the point cloud. Through color gradients, the height distribution and variations of the point cloud can be clearly observed.。 | 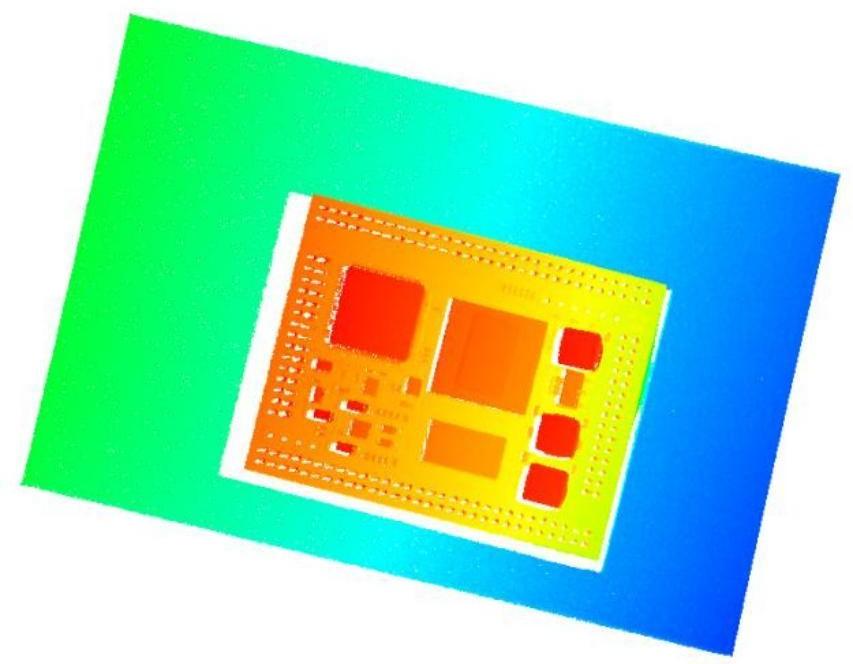 |
| Pseudo color | Overlay the pixel color of the point cloud with the thermal color to view the height distribution and morphological information of the point cloud more comprehensively. | 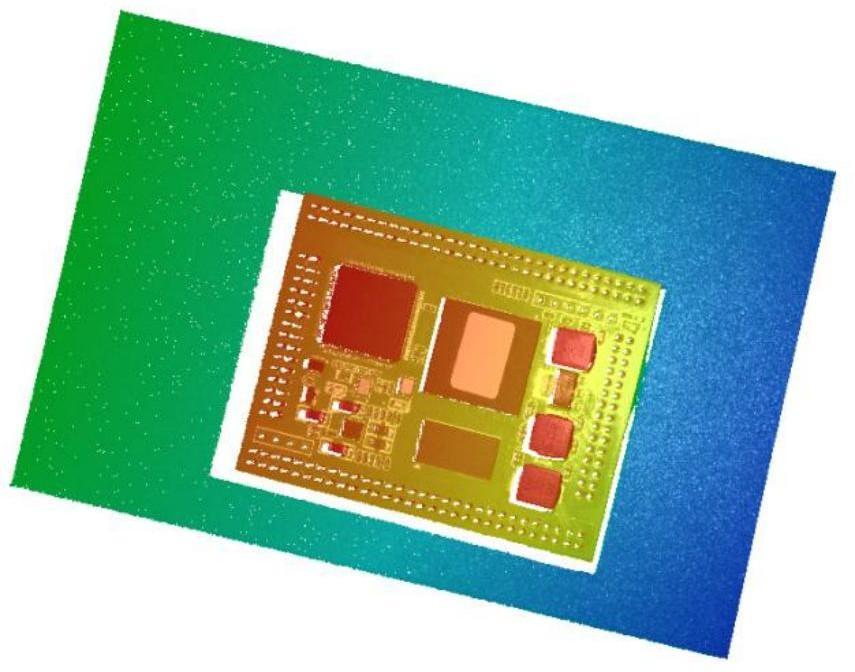 |
|---|
· Auxiliary Display
| Display Type | Description | Example |
|---|---|---|
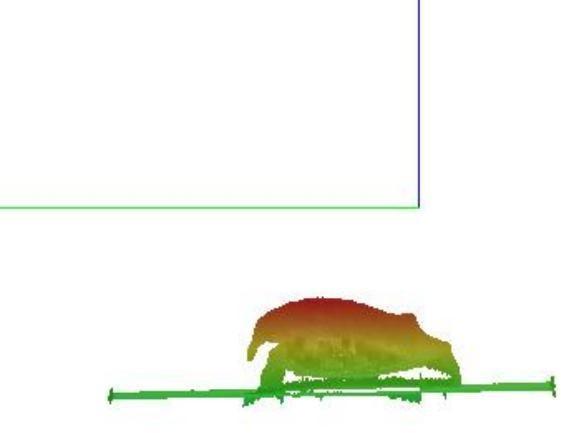
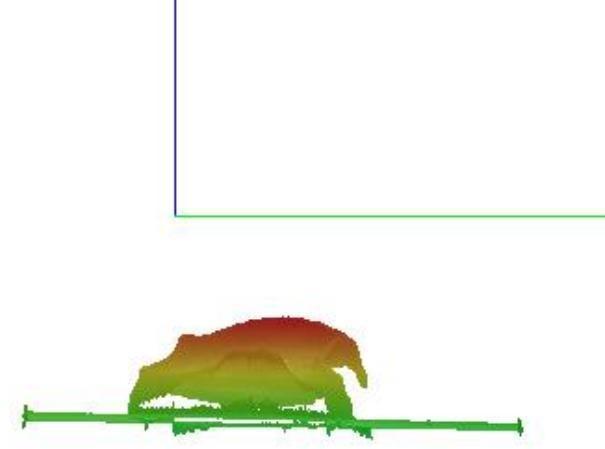
| Coordinate system display | Displays the coordinate axes of the default coordinate system, where red, green, and blue represent the positive directions of the X, Y, and Z axes, respectively. | 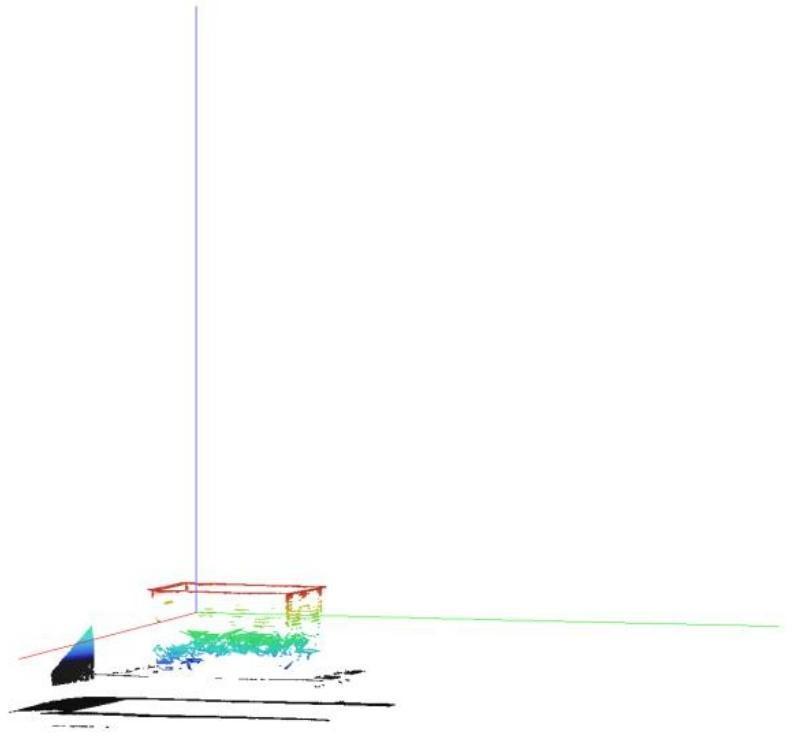 |
| User Coordinate System Display | Before shooting, the user coordinate system must be set in the parameter settings to display its coordinate axes. For detailed operations, see Section 3.4.6. Red, green, and blue represent the positive directions of the X, Y, and Z axes, respectively. The lines are thicker and shorter than those of the default coordinate system. | 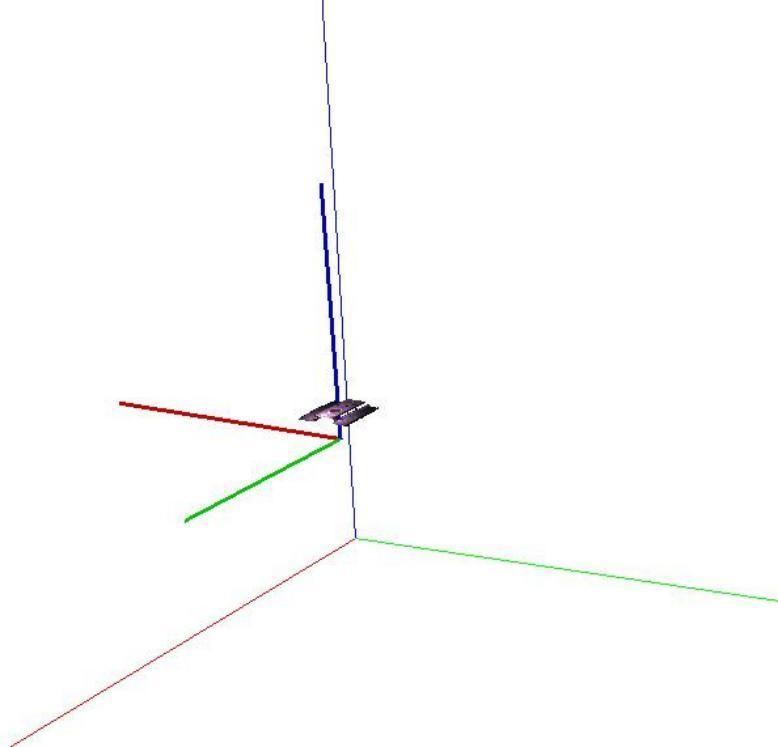 |
| Flat panel display | Use the gray plane formed by the default coordinate system X-axis and Y-axis as a reference to view the point cloud data. | 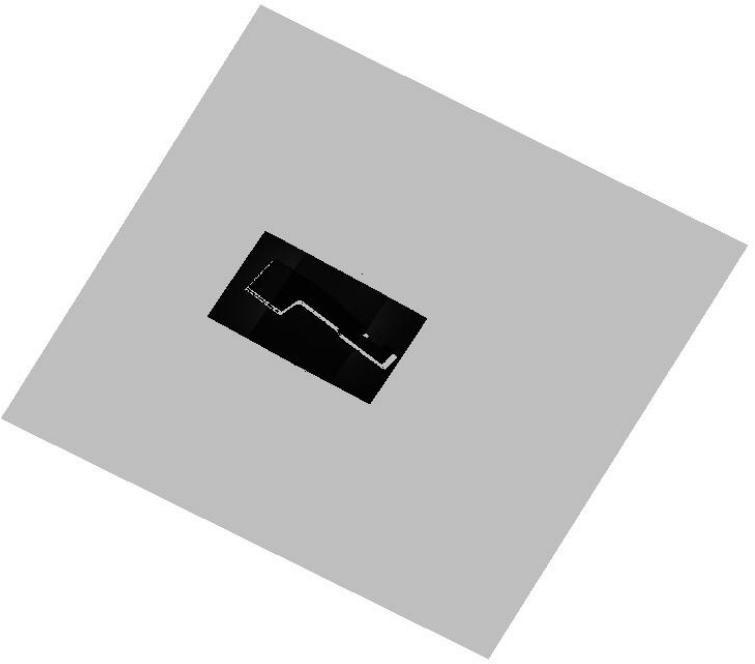 |
|---|---|---|
| Normal display | Before shooting, set the calculation of normal vectors in Parameters Settings → Post-Processing Parameters; only then will the point cloud’s normal vectors be displayed. For details, see the Normal Vector Calculation Parameters. | 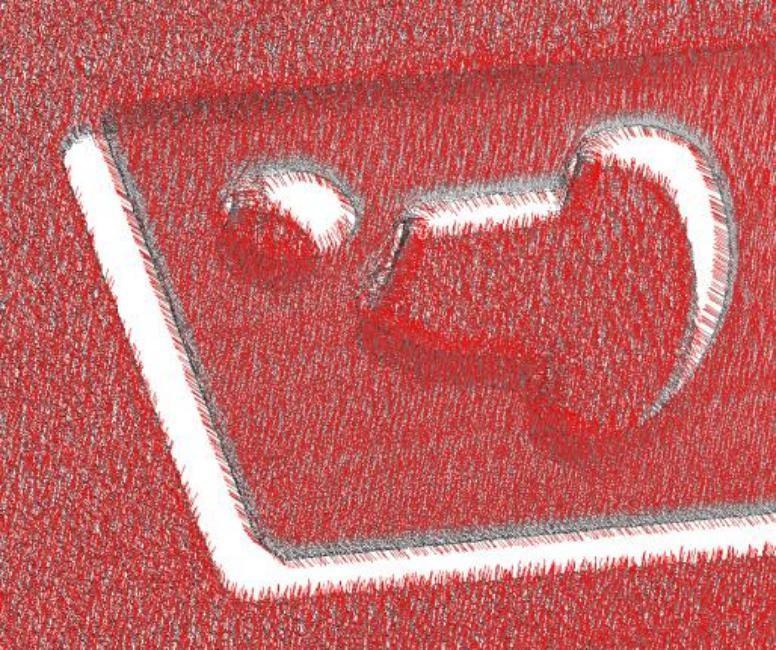 |
| Data range display | Use red, green, and blue lines to outline the X, Y, and Z ranges of the point cloud respectively. | 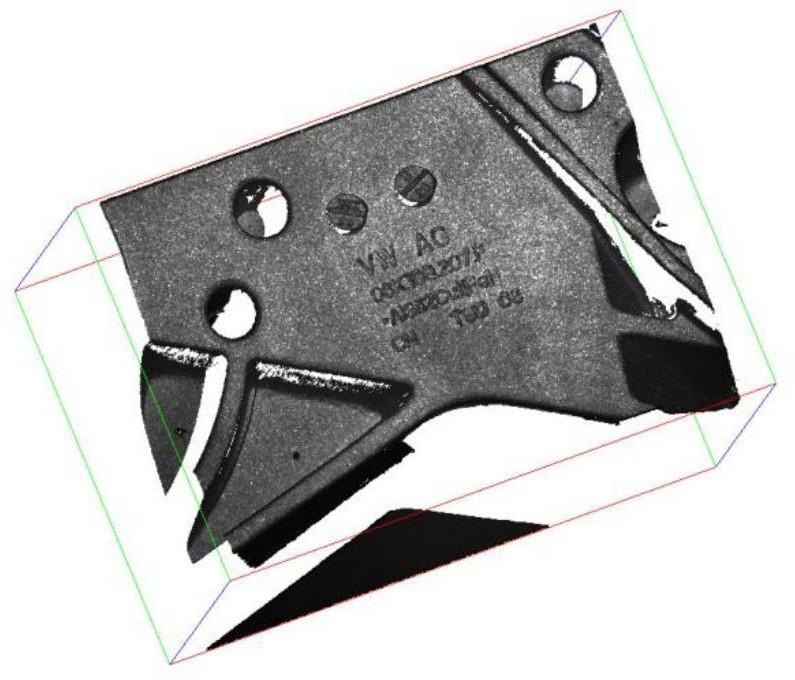 |
| Rotation center display | The rotation center defaults to the center point of the point cloud data range, which is represented by a small yellow solid circle. | 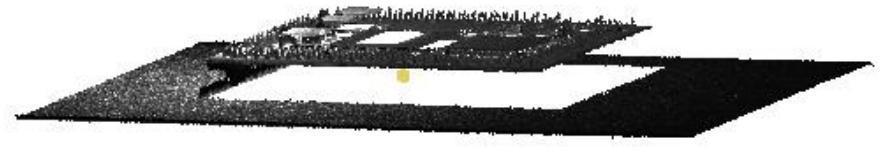 |
| Click on “Select Rotation | 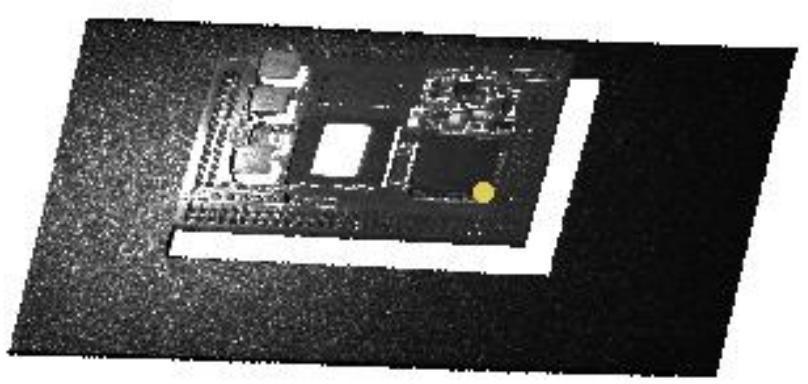 | |
|---|---|---|
| Center (middle button) option | ||
| Select the center of rotation (center key) | Then click the middle mouse button | |
| Select a point to change the current | ||
| The rotation center of the view | ||
| Set. |
· View Switching
Select to display the point cloud view from the front, back, left, right, top, or bottom angles. By default, the negative Y-axis direction is considered the front. You can return to the initial view by using “View Reset.”
| Front View | Rear View |
|---|---|
 |  |
| Left View | Right View |
 |  |
| Top View | Bottom View |
 |  |
Point cloud size
Select the size of individual points in the point cloud view, with the minimum unit being 1 pixel.
Range Settings
By modifying the data, set the point cloud display range and the heatmap display range. After successful settings, the point cloud will be updated.
Point Cloud Range: Adjust the values by moving the sliders or entering numbers to set the visible range of the point cloud; points outside this range will be invisible. Combined with the “Save Current Displayed Point Cloud” function, this can be used to cut out unnecessary backgrounds.
The right side of the popup shows the actual value ranges in the X, Y, and Z directions of the point cloud. Clicking to select different “axis range” values allows quick adjustment of the upper and lower limits of the X, Y, and Z axis display ranges. Clicking the [Auto Adapt] button will automatically adjust to a suitable display range.
When modifying the point cloud range, you can simultaneously enable the distance measurement/user coordinate system function to determine appropriate value ranges.
The table below uses setting the display range of the X-axis as an example.
| Description | Example |
|---|---|
| When the X-axis display range is greater than or equal to the actual value range, the point cloud is displayed at its actual size along the X-axis direction. | 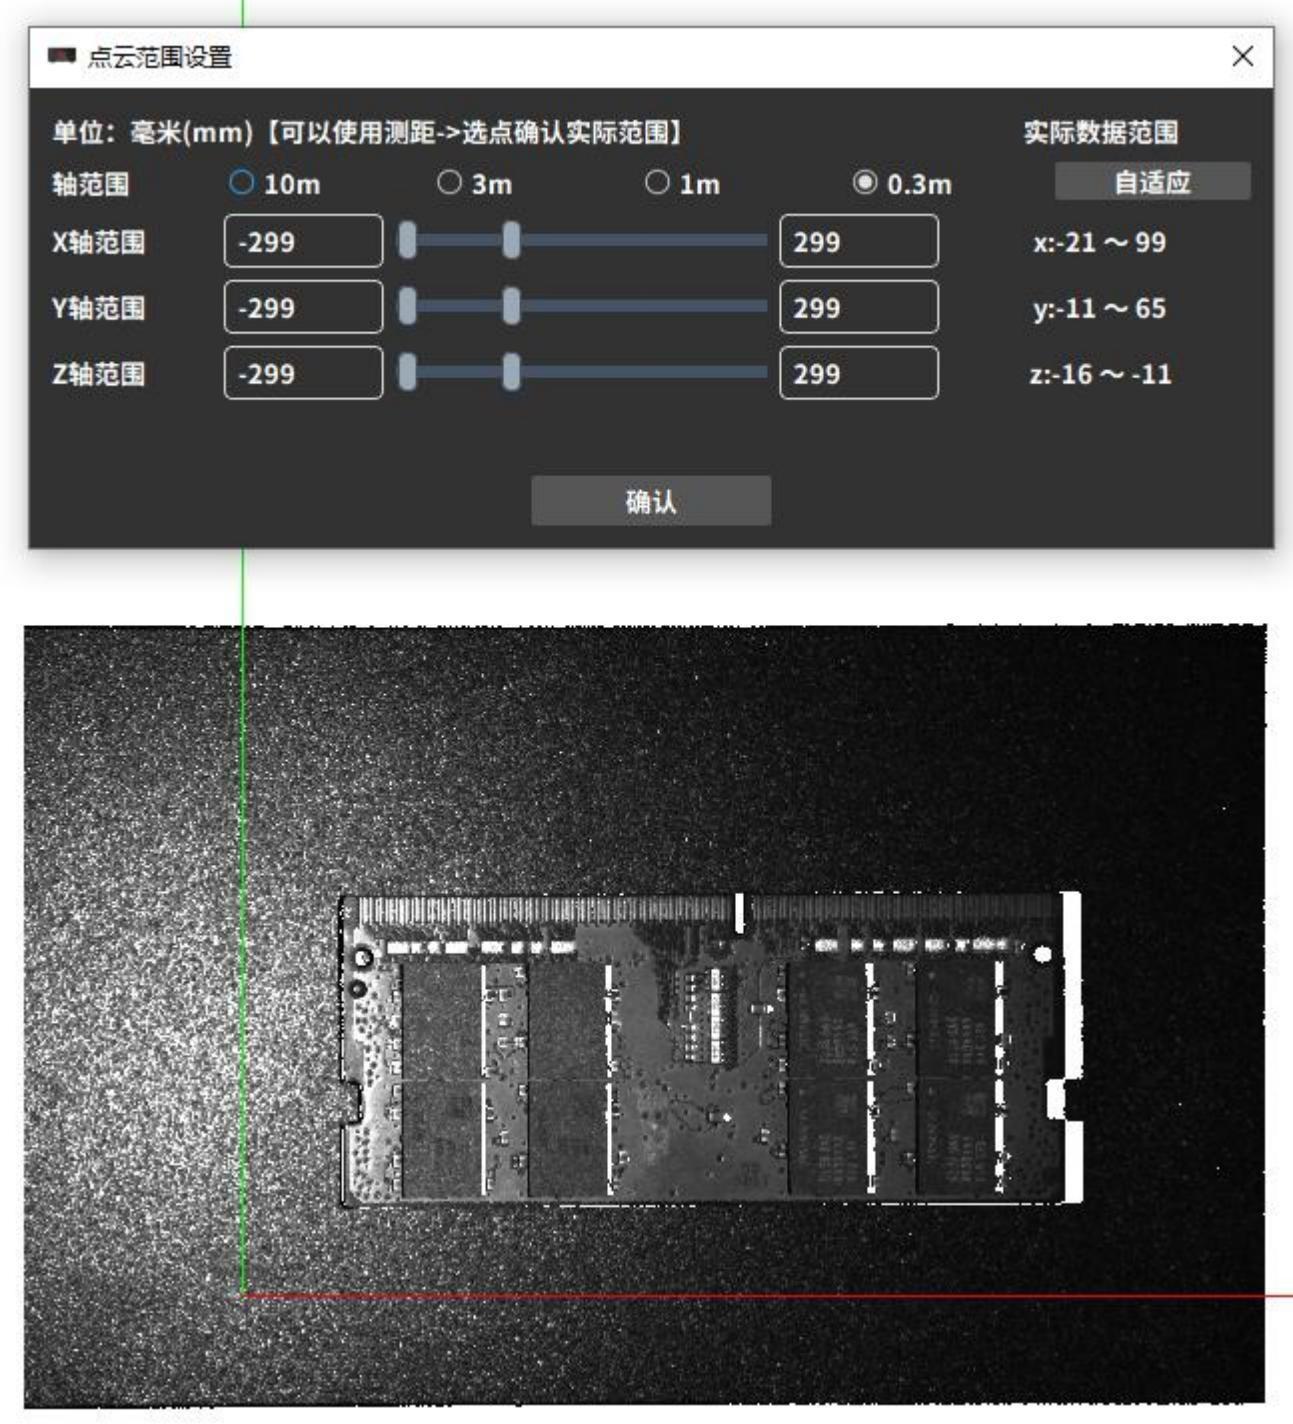 |
| When the X-axis display range is smaller than the actual data range, the point cloud only displays part of the point cloud in the X-axis direction according to the set range value. | 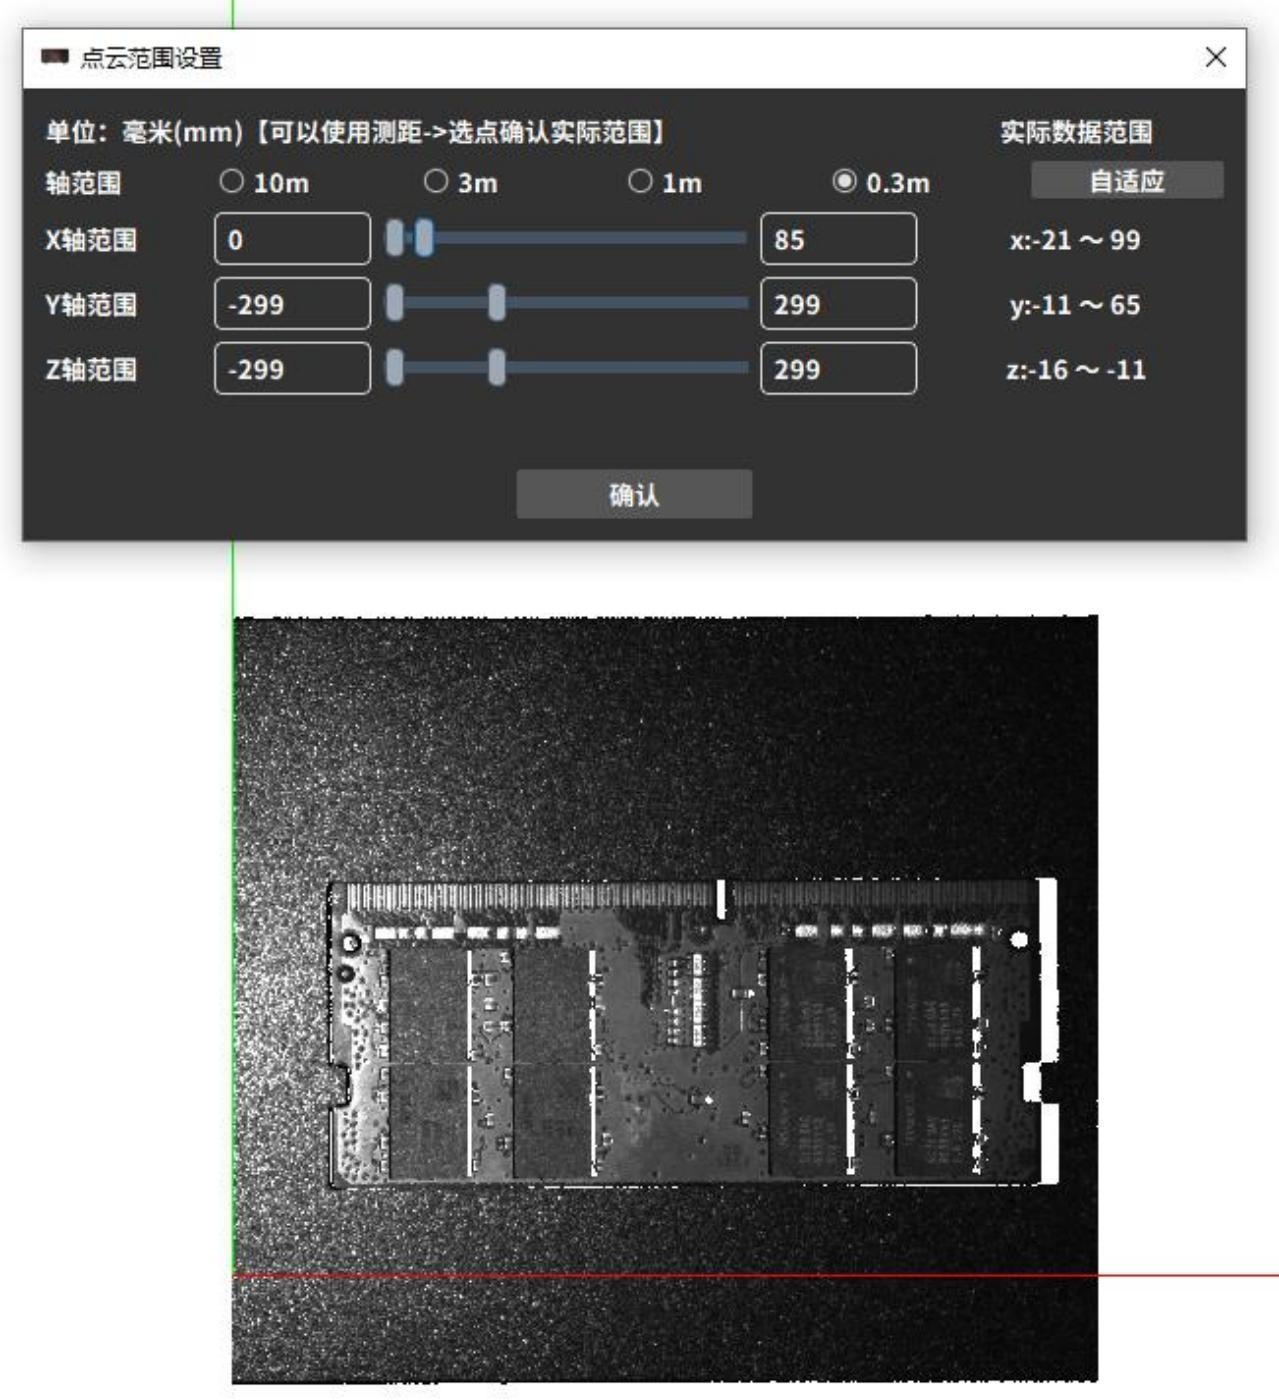 |
|---|
Heatmap Display Range:
Select the X, Y, and Z axes to choose heatmap channels. Adjust the values by moving the sliders or entering numbers to change the segmentation range and the number of segments for the heatmap colors, thereby adjusting the color display area of the heatmap.
The right side of the popup shows the actual value ranges in the X, Y, and Z directions of the point cloud. Clicking different “axis range” values allows quick adjustment of the upper and lower limits of the coordinate axis segmentation range. Clicking the [Auto Adapt] button will automatically adjust to a suitable segmentation range.
When modifying the heatmap range, you can simultaneously enable the distance measurement/user coordinate system function to determine appropriate value ranges.
The default number of heatmap segments is 1. With the segmentation range unchanged, the higher the number of segments, the richer the colors. The table below uses setting the heatmap on the Z-axis as an example.。
| Description | Example |
|---|---|
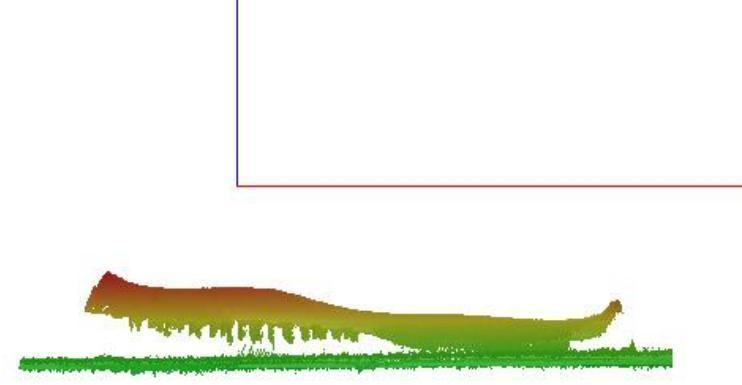
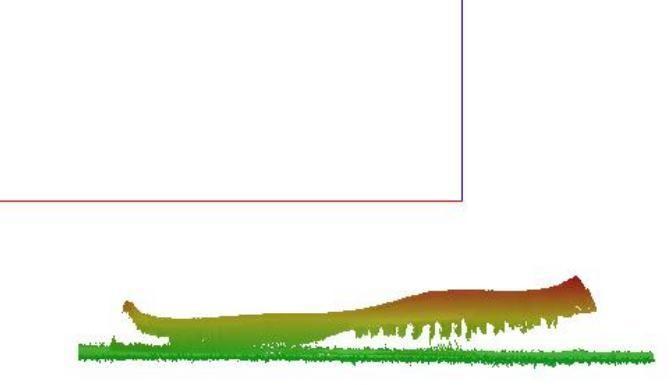
| When the Z-axis segment range is equal to the actual data range, the heat map displays the colors of the entire color band. | 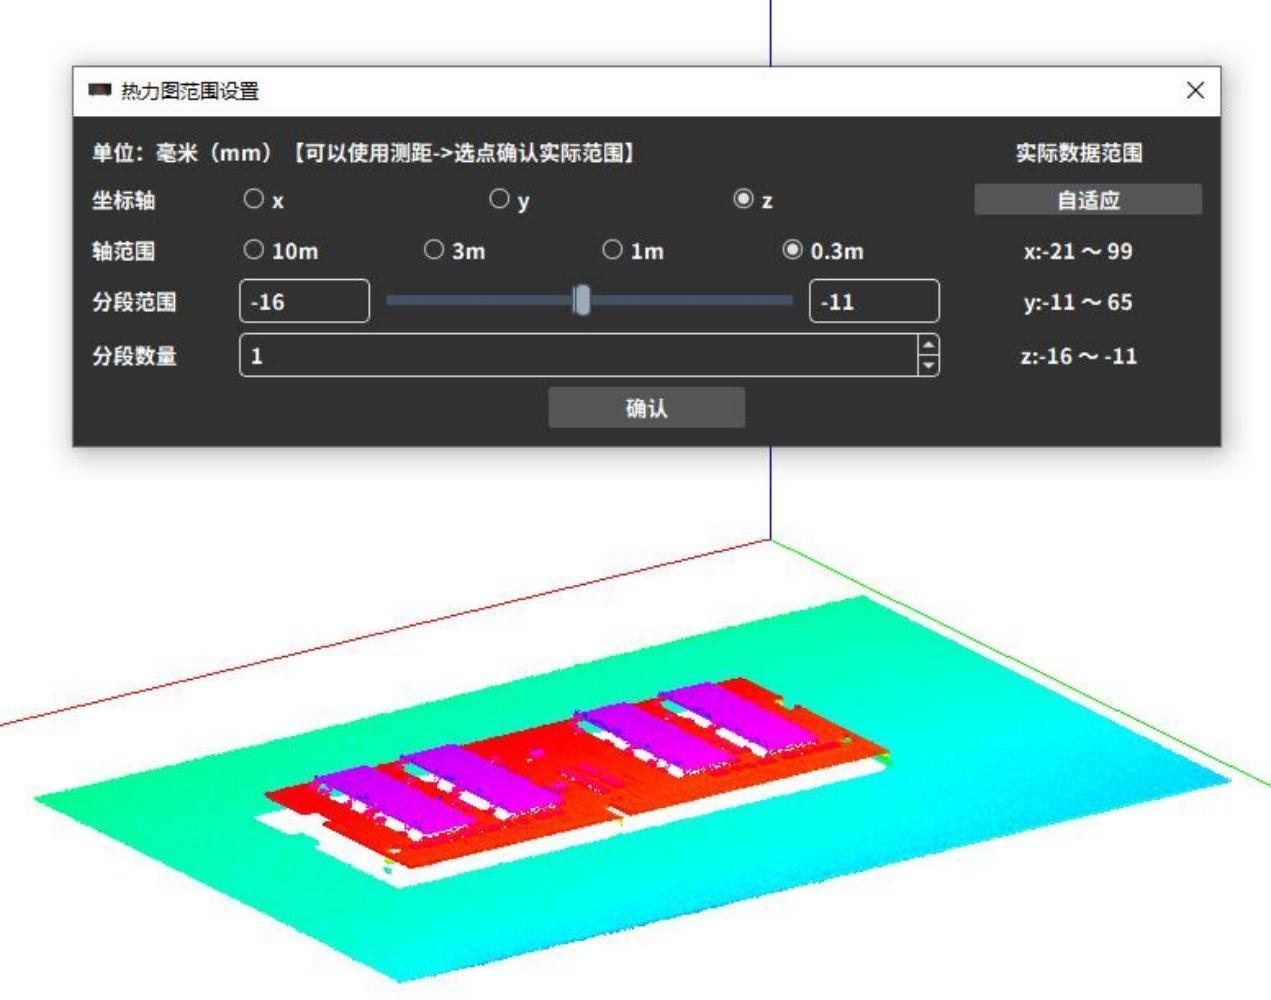 |
| When the Z-axis segment range is smaller than the actual data range, the point cloud outside the Z-axis segment range is displayed in black. | 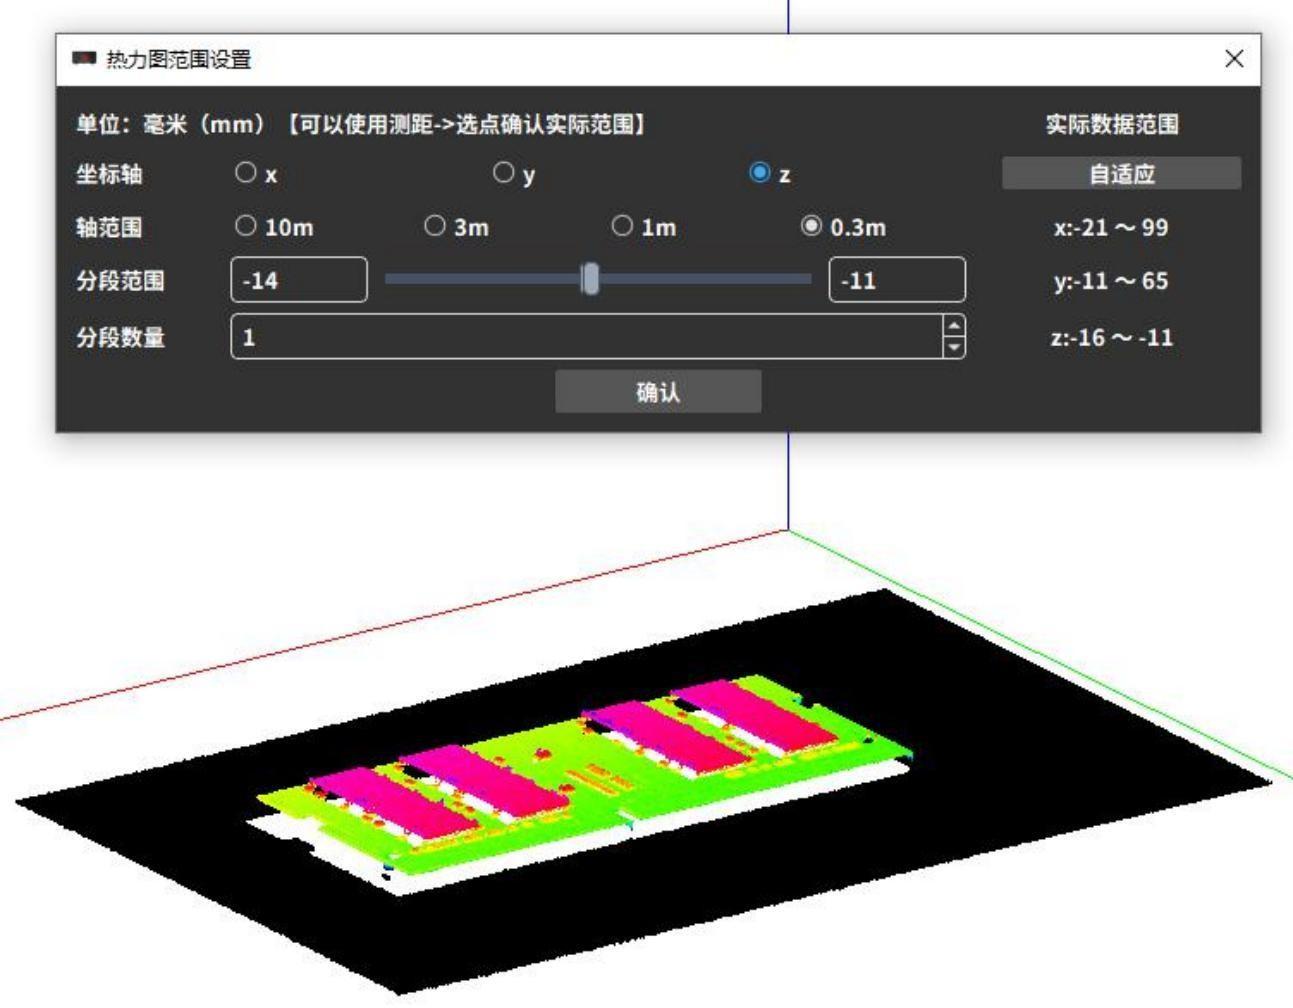 |
| When the Z-axis segmentation range is larger than the actual data range, the entire point cloud displays the heatmap colors. If the number of segments remains unchanged, the larger the set segmentation range, the fewer colors are displayed. | 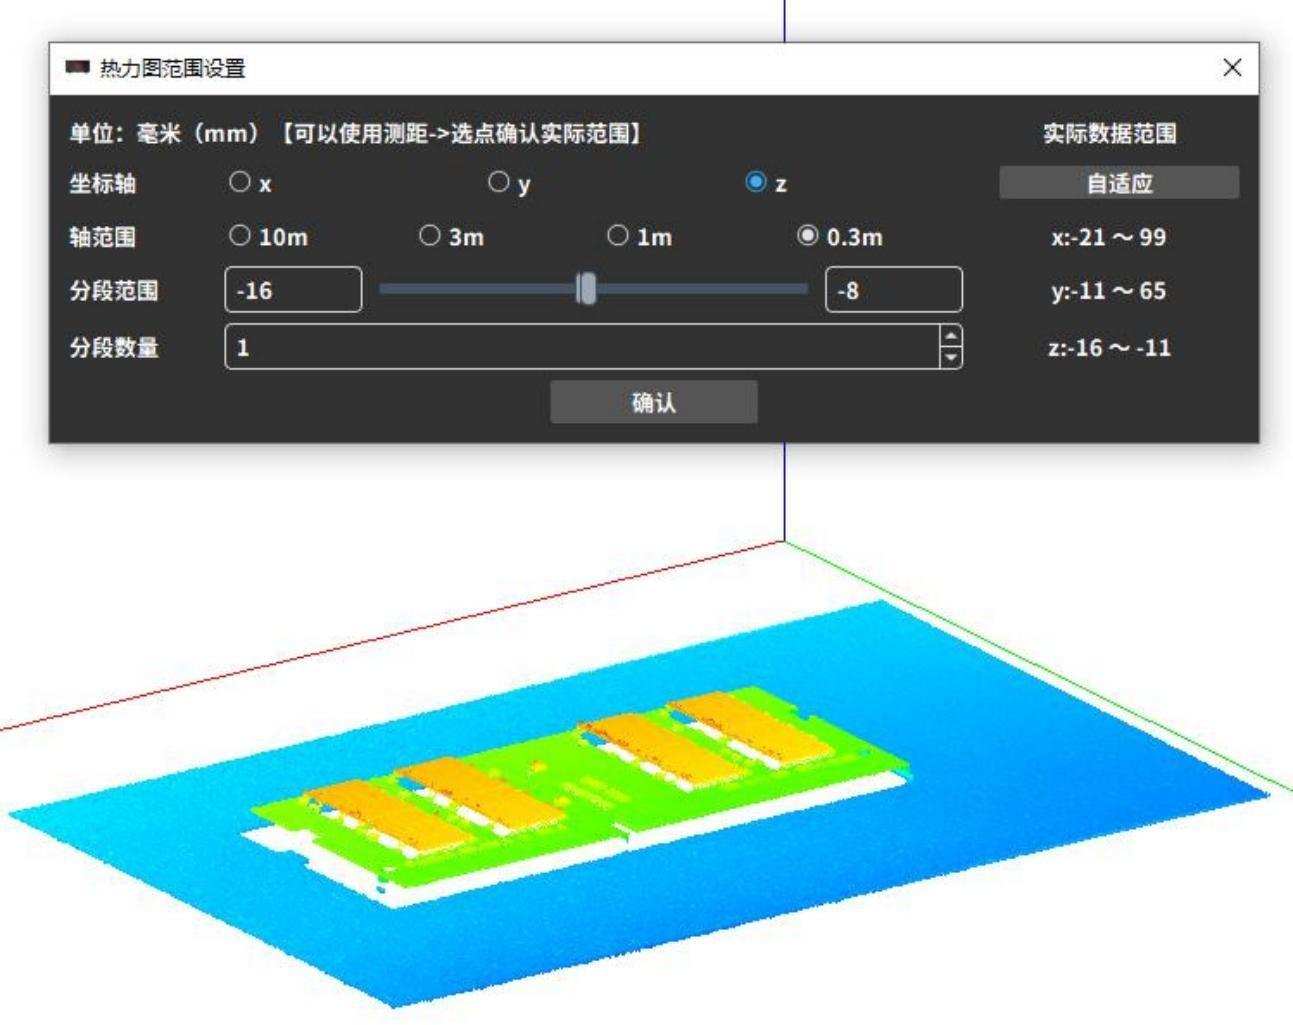 |
|---|
· Select point to measure distance
RVCManager provides a point selection measurement function, allowing you to select multiple points from the point cloud for simple measurements. It includes seven submenus: “Measurement Point,” “Measure,” “Measure Angle,” “Measure Point–Plane,” “Measure Plane (Circle),” “Re-select Points,” and “Close Measurement.” You must first select a function, then click the mouse middle button to select points.
| Icon | Quick Menu | Function Description | Example |
|---|---|---|---|
| Measur-ment Point | Click a point on the point cloud with the mouse middle button to select it; the interface will display the spatial coordinates of that point.。 | 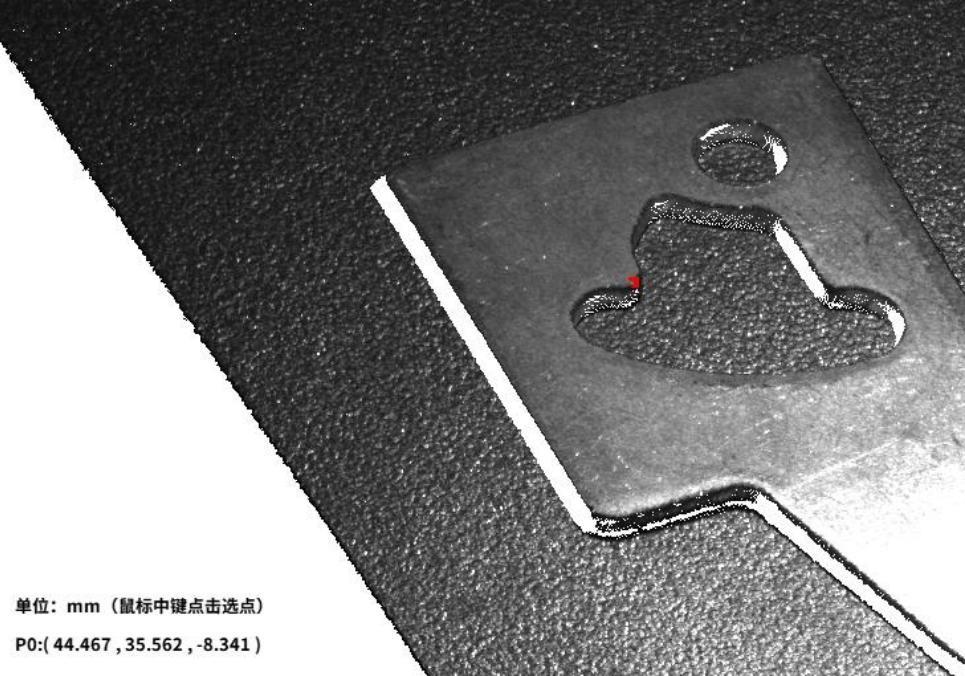 |
 | Measure Point-to-Point | Click the mouse middle button to select two points. The interface will display the coordinates of both points and calculate the distance between them. | 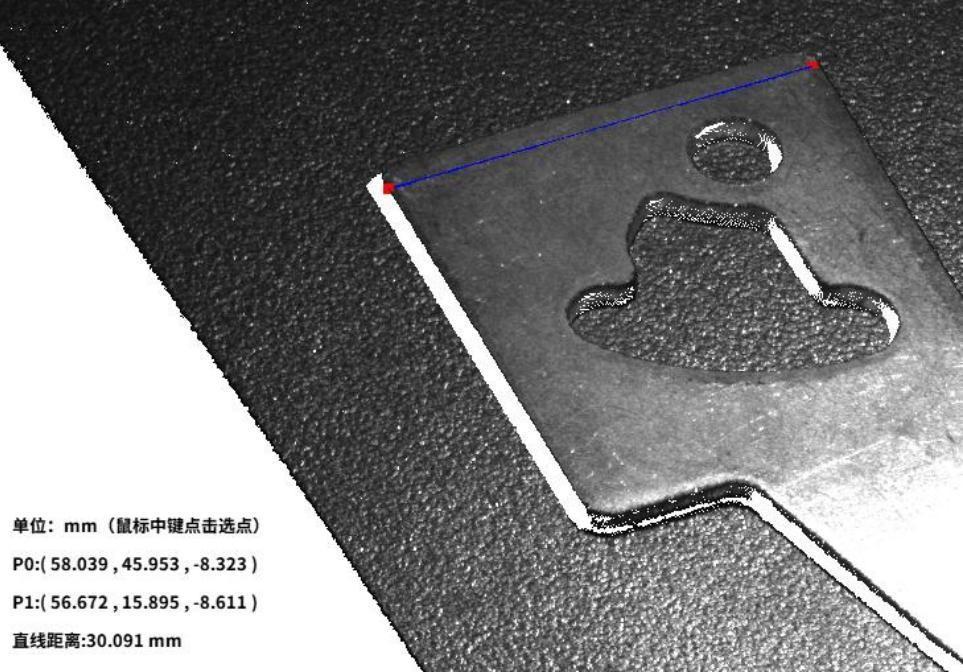 |
|---|---|---|---|
 | Measuring Angles | Click the middle mouse button to select three points. The interface will display the coordinates of the three points and calculate the angle formed by the three points in sequence (with the second selected point as the vertex of the angle).。 | 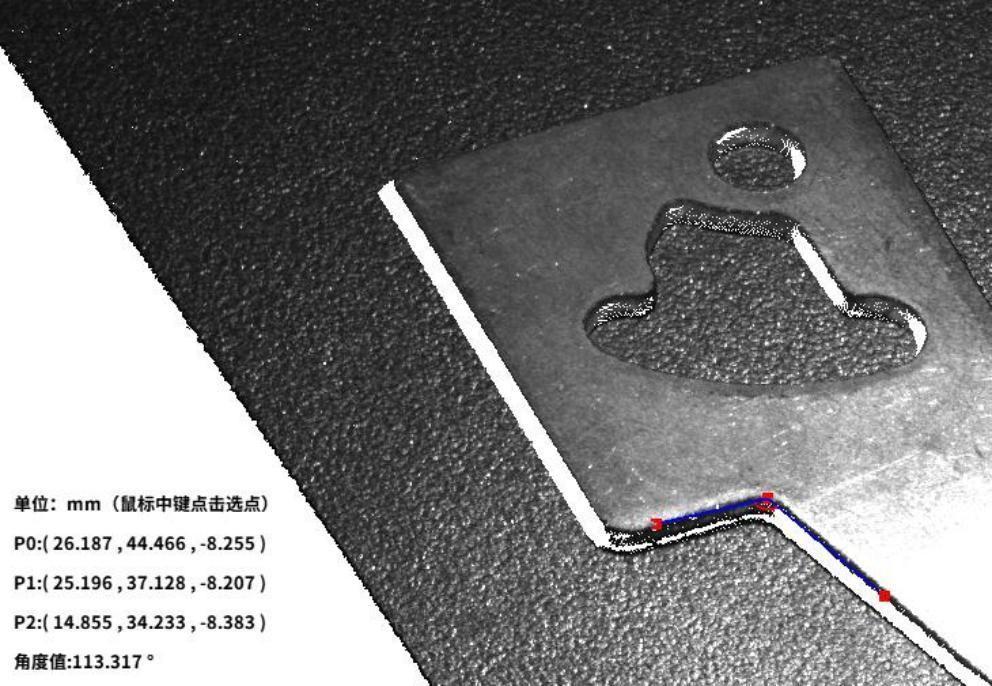 |
 | Measure Plane (Circle) | Click the mouse middle button to select three points to fit a circle. The interface will display the coordinates of the three points and calculate the radius of the fitted circle. | 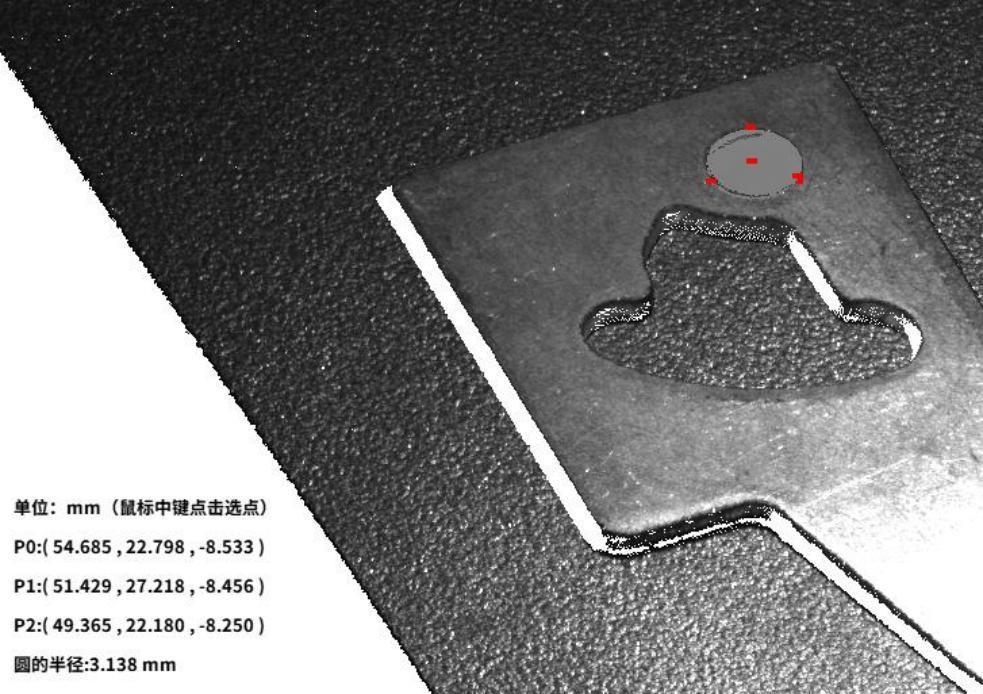 |
 | Measuring point-plane | Click the middle mouse button to select three points to determine the plane, then select a point outside the plane. The interface will display the coordinates of the four points and calculate the distance from the point to the plane.。 | 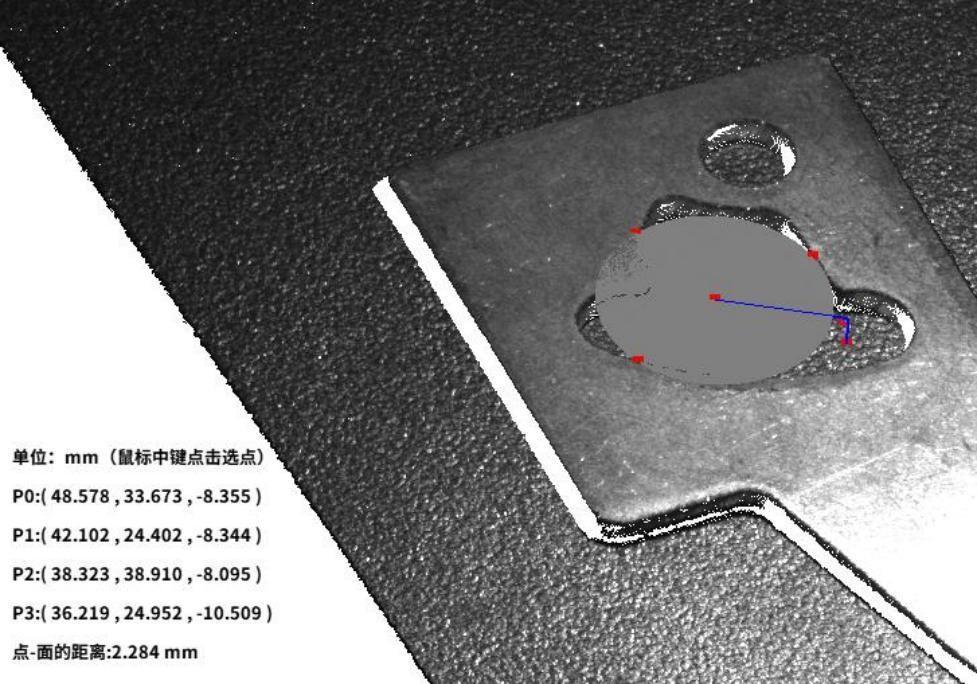 |
 | Reselect point | Cancel the currently selected point | / |
 | Close measurement | Turn off point selection | / |
|---|
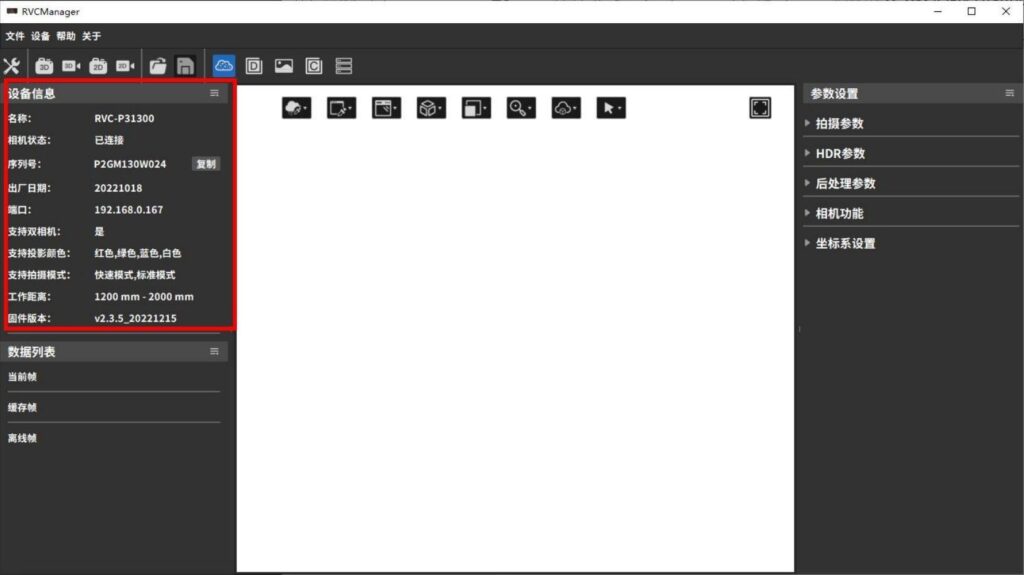
3.3.4 Frame Data and Device Information
Through the Data List Area and the Device Information Area, you can view the currently displayed frame data and the information of the currently connected device.
Data List
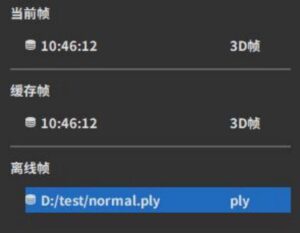
The data list is divided into Current Frame, Cached Frame, and Offline Frame.
Current Frame: Displays the most recent frame data captured, including the shooting time and frame type (2D frame or 3D frame).
Cached Frame: Data captured online can be saved as cached frames. Cached frames include complete frame data and shooting parameter information.
Offline Frame: Displays externally imported data, including the file path and file type (typically .ply). If the file path is too long, part of it will be replaced with “***”. Importing offline point clouds or saving point clouds will each add a new entry to the list. Selecting a corresponding entry displays the associated offline frame information.
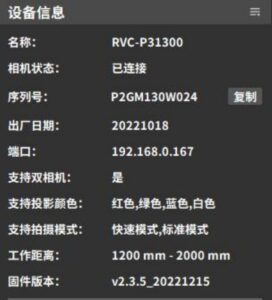
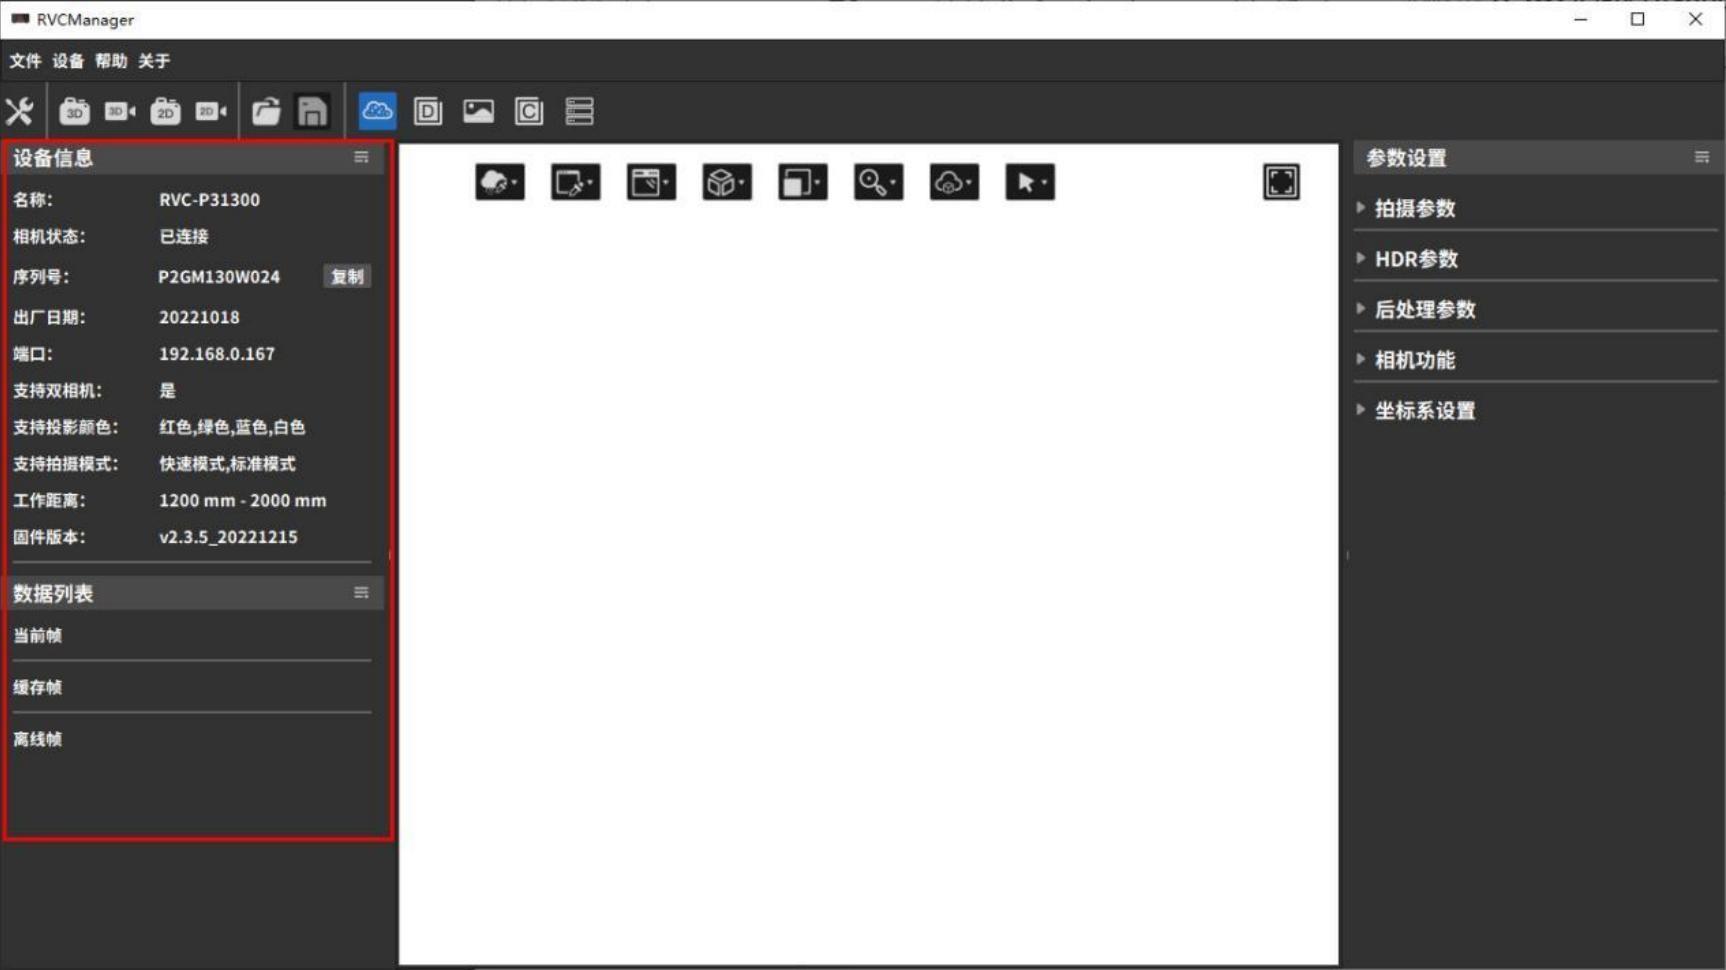
Device Information
Displays the information of the connected device. When the device is disconnected, the information will be empty. The content is consistent with the camera information shown in the Device Management popup. The camera serial number can be copied.。